Column Chart#11802

The cells of a M \times N table are colored in blue and white. In the -th of the columns, a_i of the bottom cells are colored blue, where a_i \ge 1. The table is cut into horizontal strips one cell in height. The first strip is the bottommost row of cells. The start of the second strip (the second row of cells) is attached to its end, and so on. As a result, a single strip of length N \cdot M is formed. A segment is a sequence of cells of the same color, to the right of which there is a cell of a different color or the end of the strip, and to the left of which there is a cell of a different color or the start of the strip. How many blue segments are there in the resulting strip?
The first line contains two integers and — the number of rows and columns of the table respectively (1 \le N \le 10^5, 1 \le M \le 10^9). The next line contains integers a_1, a_2, ..., a_n (1 \le a_i \le M) — the number of painted cells in each of the columns.
Output a single number — the number of segments.
Example
Initially, the diagram looked like this:
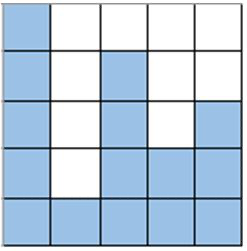
After cutting and gluing, we would have obtained the following strip:
